

[block id=”social-media-buttons”]
Introduction
Both the BenQ HT2550 ($1,499) and Optoma UHD50 ($1,399) are based on the new .47 TI DLP 4K chip. This allows a much more economical 4K projector and still enables the required 8.2 million pixels to the screen to qualify for the UHD 4K designation. Since they both use the same DLP chip, similar RGB, RGB color wheel and similar brightness they look pretty close on paper. We set out to find out if they are similar and if not, what are the differences. There are many online reviews, but no direct comparisons that we could find, so we decided to put these two new projectors to the test.
Since there are many online resources for product details, like inputs and lamp life, we will concentrate on the actual real-world image quality differences in this comparison.
Optoma UHD50 vs BenQ HT2550
Optoma UHD50 vs BenQ HT2550
Here’s a quick comparison of their major specs:
| UHD50 | HT2550 | |
| Image Type: | Single Chip DLP | Single Chip DLP |
| Native Resolution: | 4K UHD (3840 x 2160) | 4K UHD (3840 x 2160) |
| Lumen Brightness: | 2400 | 2200 |
| Dimensions: | 15.4″ x 5.1″ x 11.1″ | 13.9” x 5.3” x 10.7” |
| Weight: | 11.75 lbs. | 9.2 lbs. |
| Typical Price: | $1,399 | $1,499 |
Color
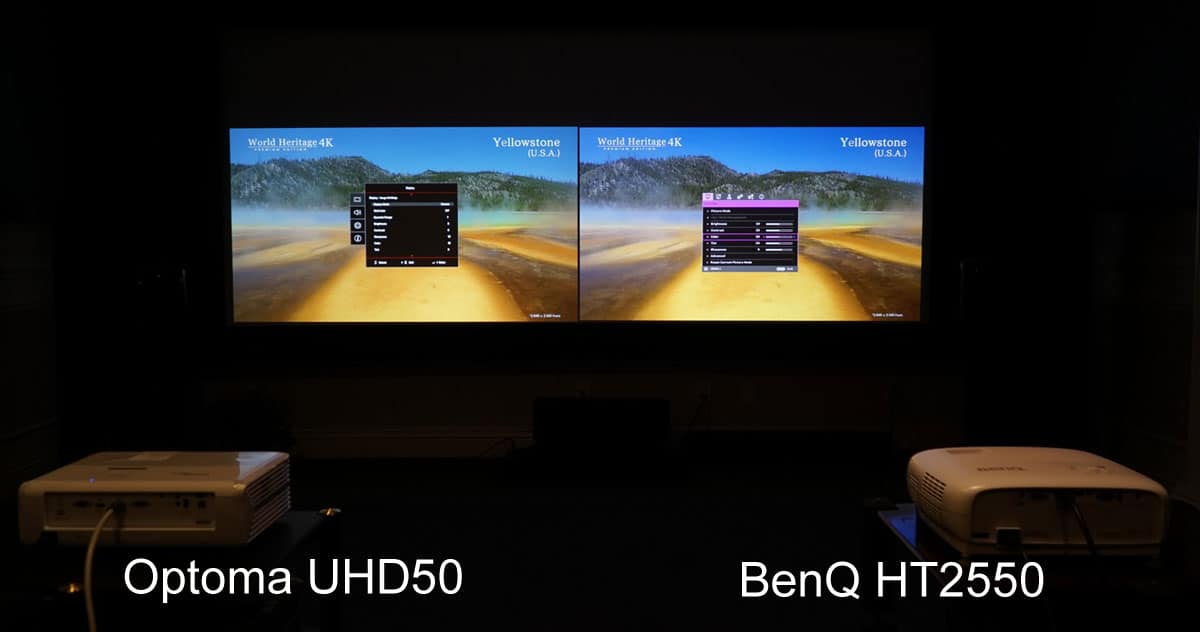
On first glance, the two projectors did seem very close and I can understand why some reviewers have not seen the differences; because some of them were a surprise to us. Both use a similar color wheel, and other than some specific settings one might change out of the box, they did appear similar on 1080p signals up-converted to 4K. We put both projectors in their Cinema color modes and set the lamps to Eco-mode. We did not do a full calibration on these projectors because most people in this price range are not going to spend up to half the cost of the projector to have a full calibration done, and then, in most cases, find out the projected image is not quite as bright as it used to be (good color usually requires a sacrifice in brightness)! Color bars were slightly different, but not as different as we have seen on some other home theater projectors. The BenQ was surprisingly much brighter, and at first look, the color seemed very close. This is very interesting, as the BenQ specifications would indicate that its rated brightness of 2,200 lumens would not be as bright as the Optoma’s 2,400 rated brightness. At least on the two samples we had, the opposite was true! Even on some 4K (non HDR content) they both looked similar, in terms of color, but then we looked a little closer.
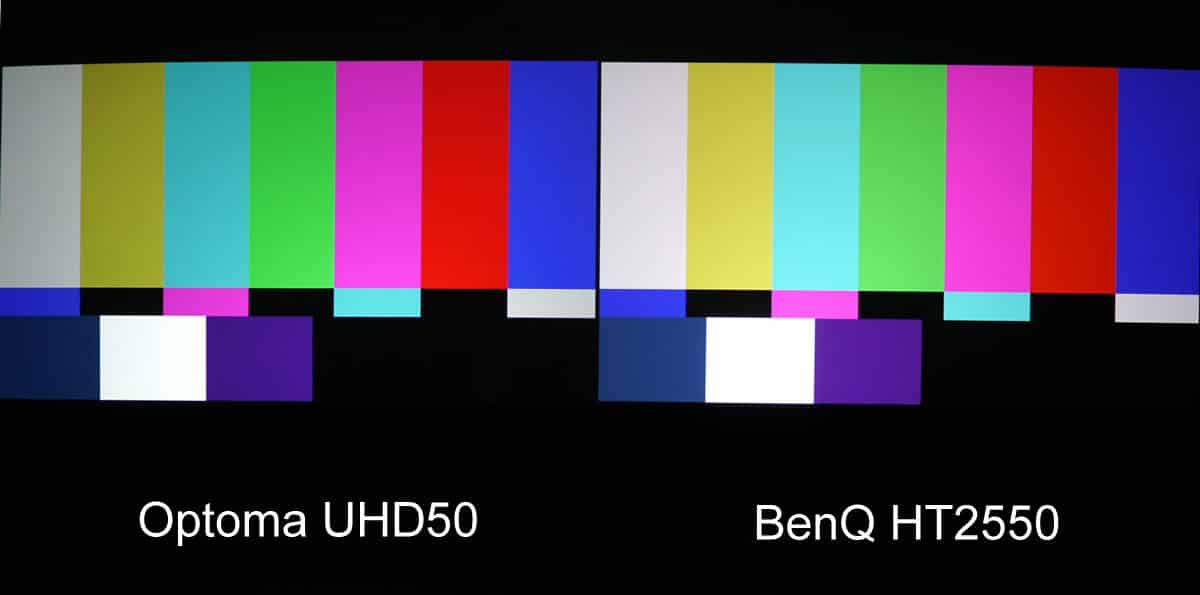
Standard color bars side by side looked very similar except the BenQ was slightly brighter.
Even some 4K images looked very close in terms of color at first setup. Look closer there are differences.
To find out how close the color really is, we set up the color calibration equipment and took some measurements from both projectors. REC709 standards, used for HD, were indeed both very close, as you can see from the charts below. The Optoma uses a default Brilliant color setting of 10, and the BenQ uses a setting of “on” as it only has on and off choices in the menu. This was our first clue as to how different these projectors really are.
Here are the results:
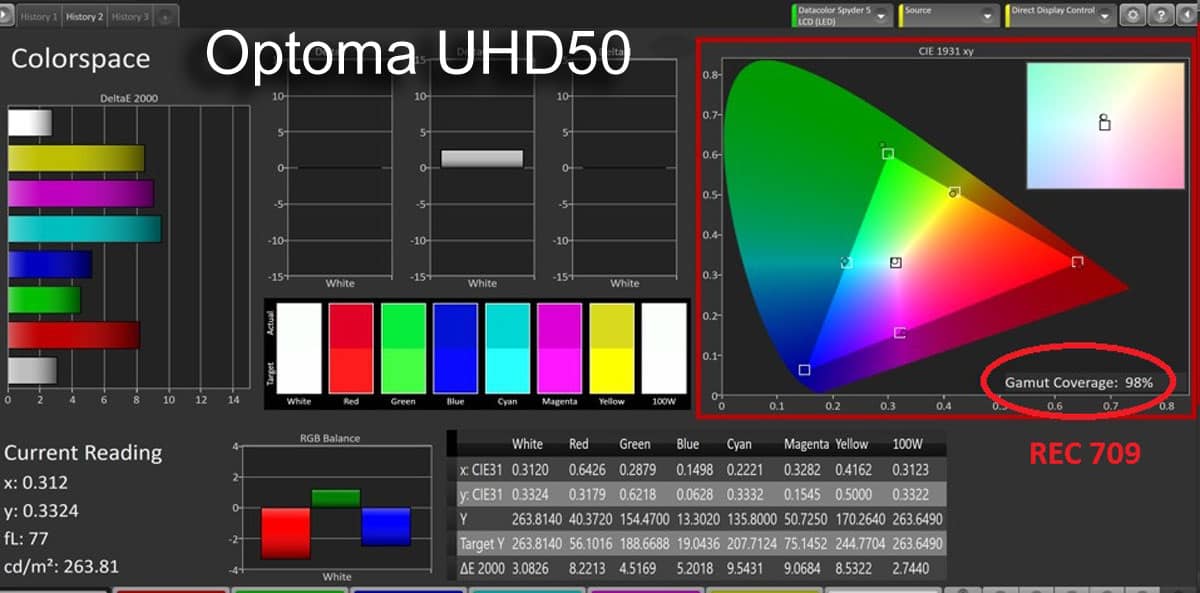
The Optoma UHD50 hit most targets and achieved 98% of REC 709.
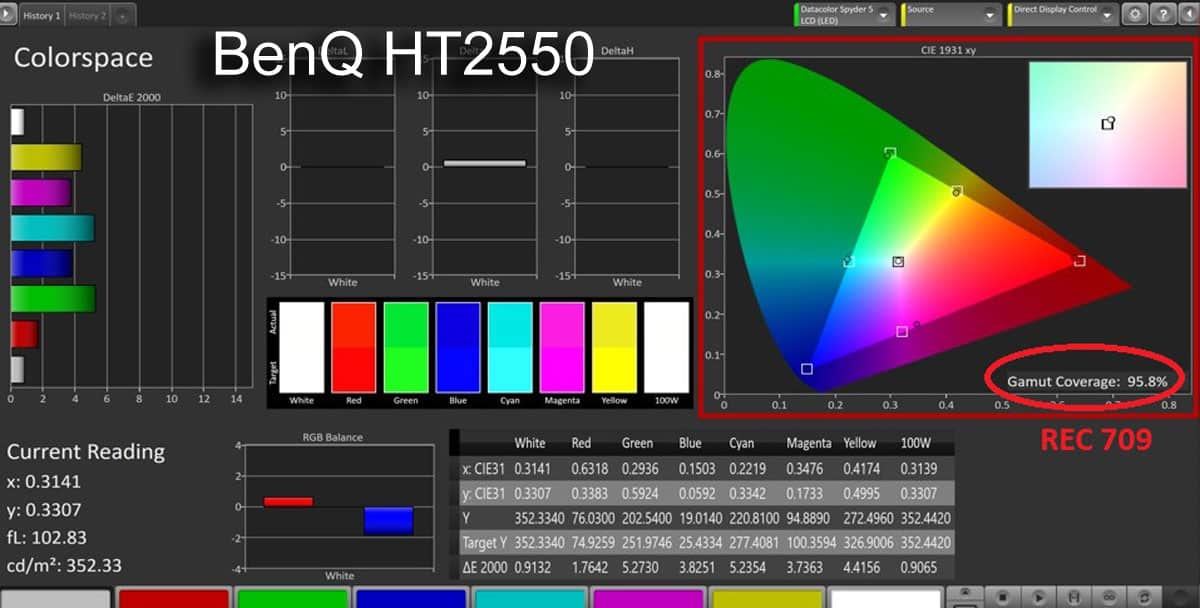
The BenQ HT 2550 also did very well on REC 709 but not quite as good.
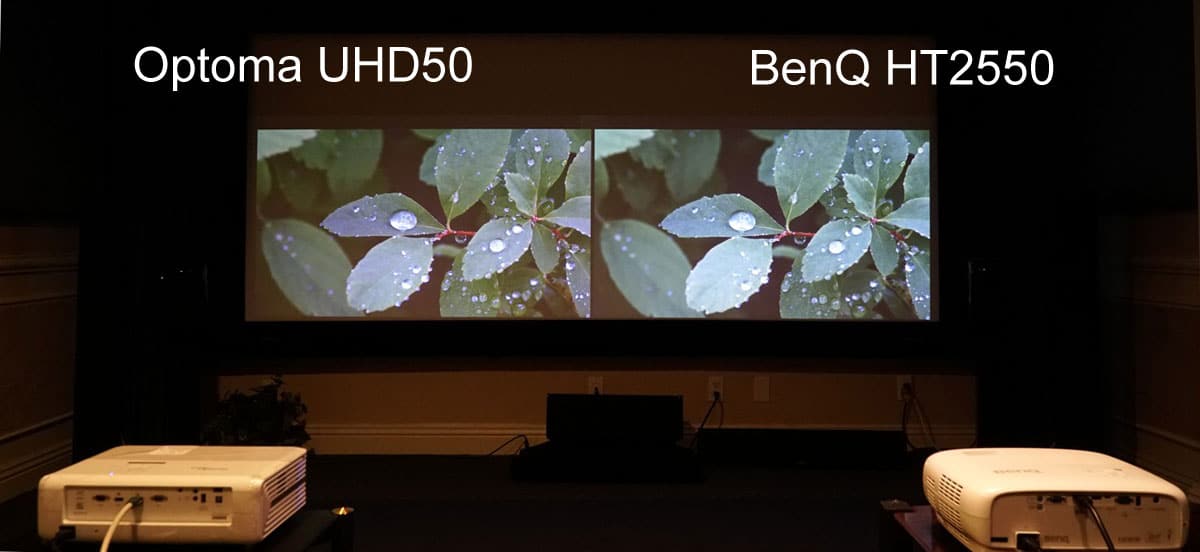
As we began to look at more images, we did see some differences in the color, even on 1080p. Since we do not know what the the BenQ brilliant color settings are, we tried both the “on” position and “off” position but on most scenes it had a very slight effect. The differences, we felt, were most likely due to the color light, or how much color as a percentage of brightness (called “color light”) was in the image, and not so much the color gamut (at least in non-HDR sources).
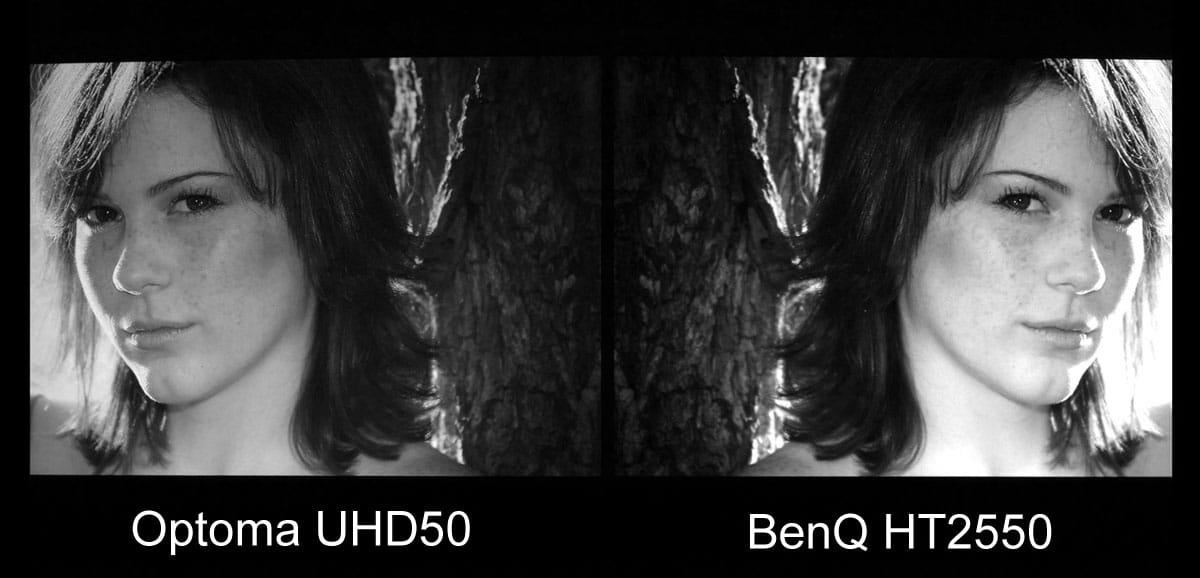
Some differences were visible even on 1080p images like this one from the Extron Shootout Disc.
The real surprise came when we started to view 4K HDR sources. The color differences became very noticeable, even to those who do not have a trained eye. If these projectors were reviewed separately, as they have been in most of the reviews we have seen, these differences may not have been so dramatic. Keep in mind these are out-of-the-box settings with very basic black level and contrast levels set using a Spears and Munsil test disc. Even after we saw the dramatic differences in HDR, we tried most of the adjustments that were available in HDR mode but could not get them to match.

Dramatic differences were discovered in 4K HDR sources like this scene from Guardians of the Galaxy II.
In all cases, the BenQ HT2550 was brighter but could not reproduce the more accurate and realistic colors we were seeing with the Optoma UHD50. Even though they both use an RGB/RGB color wheel they are using different processing to each achieve their design criteria. We felt like the BenQ, with its 3D capability, decided to design a higher brightness image and give up some of the color in order to achieve a better 3D experience (3D glasses cut the brightness down considerably). When we decided to test the maximum color gamuts of both projectors to see if this could help explain the HDR color differences, we found that indeed this was part of the difference we were seeing.
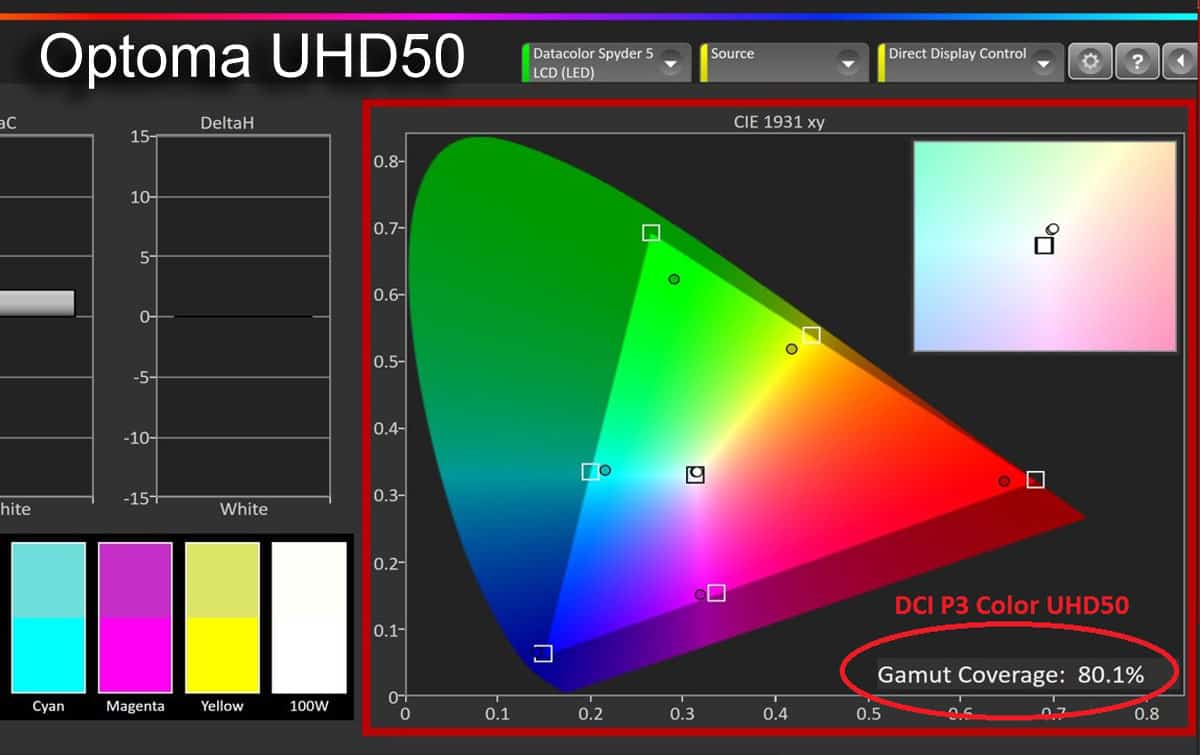
Very impressive maximum color gamut of the UHD50 in this price range. 80.1% of P3.
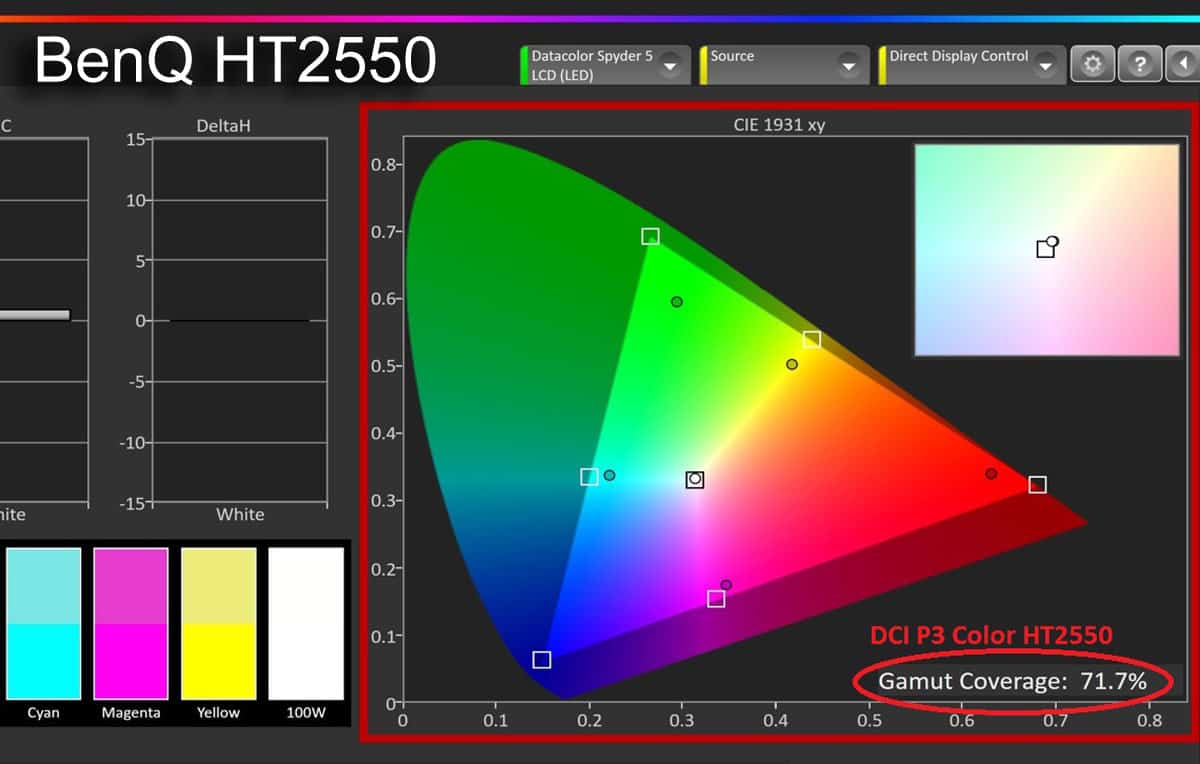
The BenQ widest color gamut hit 71.7% of the DCI P3 color space.
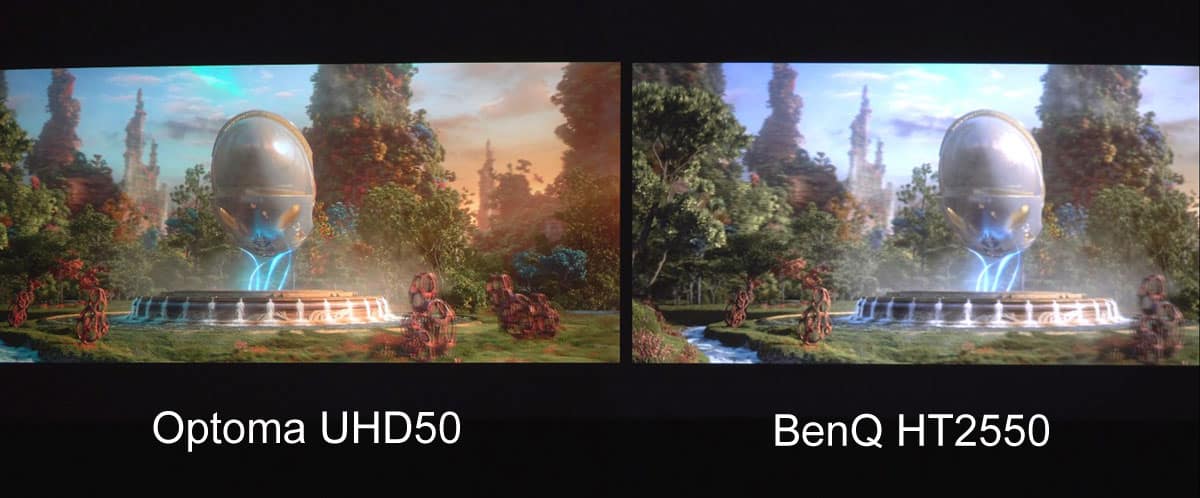
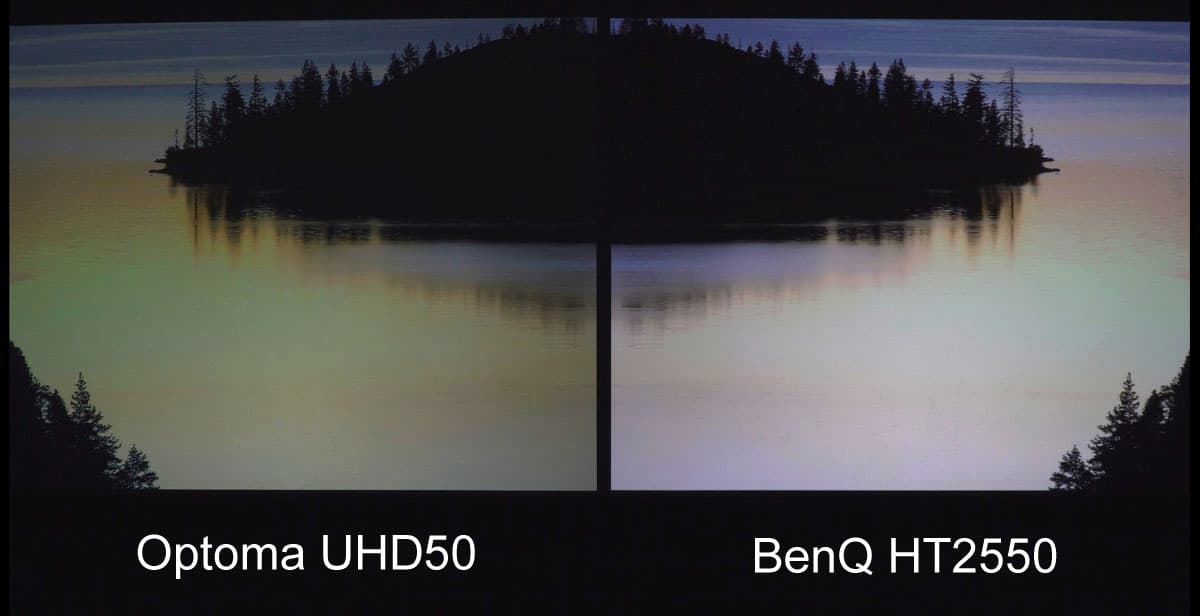
Here you can clearly see the color differences on another scene from the 4K HDR version of Guardians of the Galaxy II. Note: The foreground blurring is caused by the slow shutter speed and the slight frame difference is by the processing delay differences.
There are clearly differences between these two projectors. It would appear that BenQ chose the brighter white light output for their 3D capability, while Optoma chose to go for more accurate and saturated colors and left 3D for their slightly more expensive version, the UHD51A coming out later this Spring.
4K HDR
The goal of 4K HDR is to come as close as possible to REC 2020 color gamut, which is a very lofty goal as even the best flat panels, to my knowledge, have not yet been able to achieve full REC 2020. Even though these two projectors do look very different on 4K HDR sources, the real color differences are attributable to three reasons from what we can tell. The BenQ has designed this projector as primarily an entry-level 4K projector that can also do HD in 3D from Blu-ray sources. In that design, it became very clear that they chose to favor brighter light output over more accurate color. When it is in the HDR mode, their tone mapping (the directing of the colors it can do to the REC 2020 space), is not very impressive with regards to color saturation and wide color gamut. The Optoma, on the other hand, has paid more attention to getting the color more accurate and using what wide color gamut it does have to more correctly map to the REC 2020 reference.
Color Gamut Readings
| REC 709 HDTV Reference | DCI P3 Wide Color Gamut | Approximate REC 2020 Color | |
| Optoma UHD50 | 98.0% | 80.1% | 57.7% |
| BenQ HT2550 | 95.8% | 71.7% | 51.5% |
This explains that while we did see some differences in HD sources, the real differences became very apparent on 4K HDR sources due to the wider color gamut, and the very different way in which each manufacturer chose to display those colors in the HDR modes of each projector.
Contrast and Black Levels
Very good contrast and very deep black levels are what separate good home theater projectors and give that extra dimensionality and depth to the image that conventional business class projectors simply do not do. Since black levels are so important to this class of projectors, and there are no standards for measuring or comparing black levels other than side-by-side viewing after proper set up, we decided to set up some black level tests that we will be using starting on this comparison and all future comparisons. The following are the results of how these two projectors compare using these new tests.
Pure Black
The deepest black or “Pure Black” is measured at 0 IRE, or the beginning of what is considered the projected image. This can only be measure and compared if both projectors are first set up with basic calibration of a “Pluge” or setup pattern. If this is not done correctly, the results are meaningless as the projector may not be at its peak, or lowest level of black. This is not a full calibration and can and should be done on any display to make sure the display, projector, or flat panel, is able to display its widest range of contrast and best black levels. The contrast control of the projector or display should also be set at this time as the two controls, brightness and contrast, interact with each other and should be cross checked after setting each one.
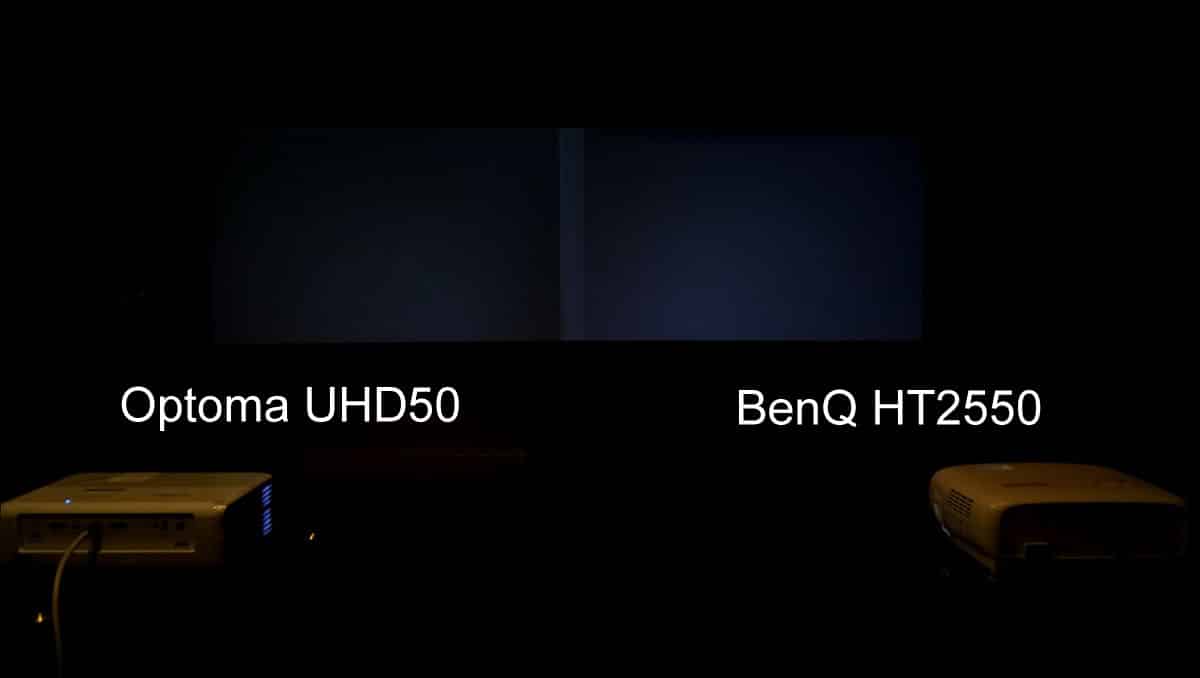
0 IRE, or “Pure Black” comparison. The Optoma on the left has the slightly better black. Note: Normally this is tested with all lights off but shown here with some light to show difference. Also their is a slight brighter area near the center caused by the overlapping of the surround borders around each image on this level of projector.
Near Black
The next black level test we did is what we call “Near Black” – an all-black screen except for a very thin-line border frame to make sure any lamp dimming, or iris control, is active but cannot be off to the point the boarder is not visible. Once this pattern is displayed, we measured the center of the screen to see how well the projector can display black while still reproducing the white thin-line border. This is where more expensive projectors use either an iris, advanced light dimming, or both, and is what really begins to separate them from their lower-cost counterparts. Neither of these projectors have an iris, so the differences you see are the result of light control (or just their native contrast).
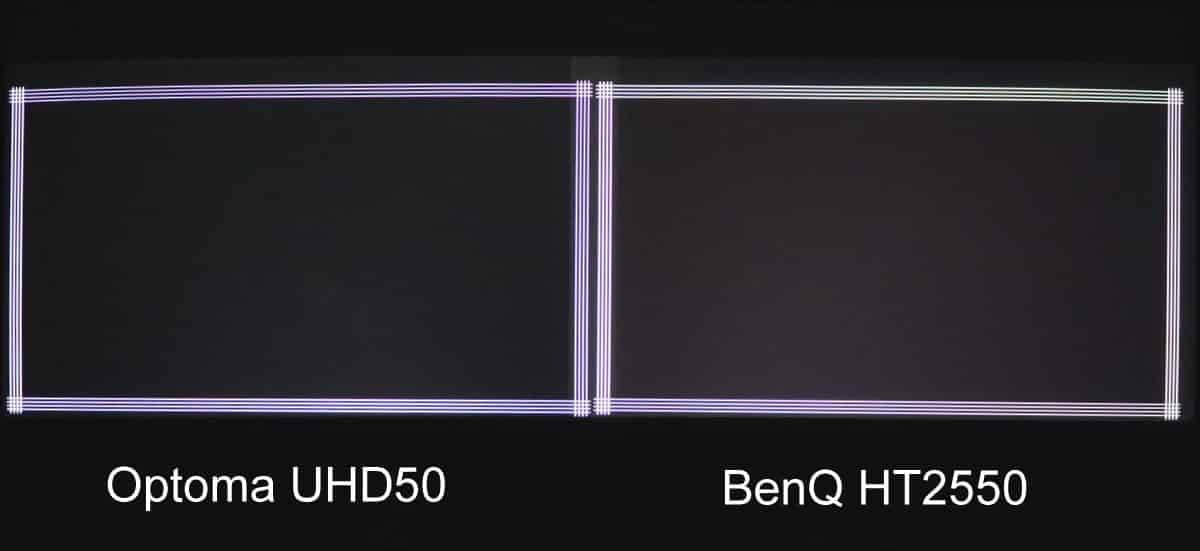
In our “Near Black” test the Optoma is again slightly darker than the BenQ. Neither white frame was dimmed from what we could determine.
The next black level test we did is called “Semi Black.” This test pattern has larger areas of white than the “Near Black” test above, but not equal amounts of white and black like the ANSI contrast pattern. In most cases, even the most expensive projectors must now not use their iris or light dimming if they have it, or they will affect the white squares and the overall contrast of this image. Because the majority of this image is still black, it is a good test for how well a projector can reproduce blacks while at the same time producing whites. There are some who say a test like this is not realistic of an actual scene because most scenes do not have 100% white parts. When it comes to 4K HDR that is not really the case. 4K HDR is trying to reproduce all the tonal values and range that it can. When it comes to HDR, those 100% or near 100% highlights are important and can give the content that extra pop and extend the detail in the mid range as well. It is also part of the tone mapping process of the color. If the highlights are not displayed at the very highest levels, and mid tones are displayed at lower levels, the image can appear less bright than a normal HD image on the same projector and the added value of the HDR content is not fully realized.
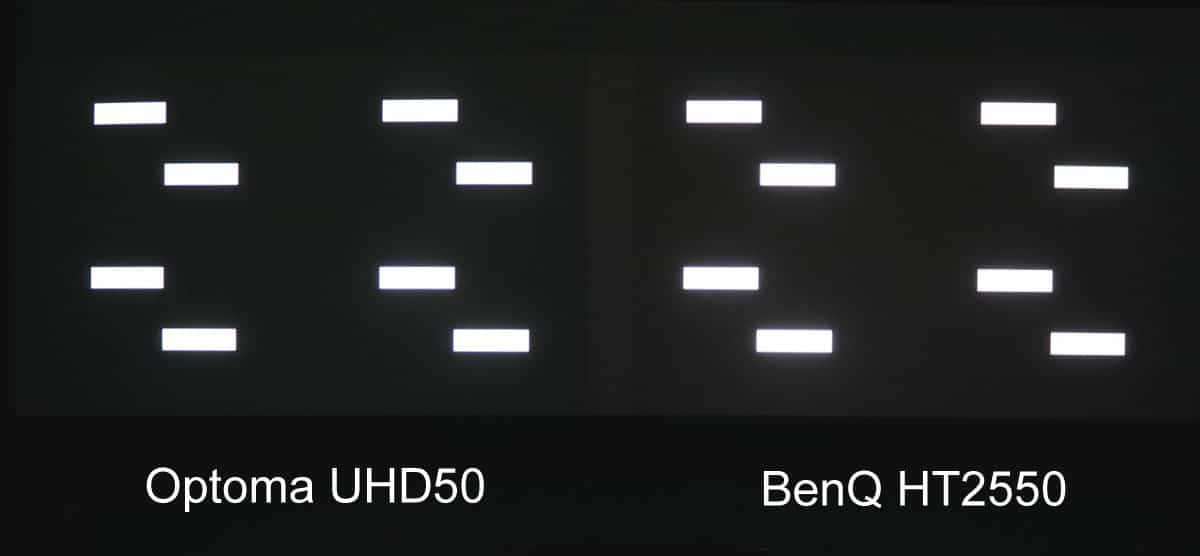
Black area on our “Semi Black” test on the right not quite as black, or “deep,” as the Optoma on the left. Note: Entire image is slightly over-exposed to show differences. You may need to adjust your monitor or display brightness control so you can see the difference.
Contrast
The contrast of a projector is definitely related to black level performance, but they are not the same thing. A projector may have very good contrast but, without an iris or light dimming, may not have excellent black level performance. The only real standard for measuring contrast is the ANSI standard. Many home theater enthusiasts may argue that it is not a good test for for home theater projectors because most scenes do not have large areas of 100% white like the ANSI test pattern does. We understand that, but again for some outdoor 4K HDR scenes there may be multiple areas of the image approaching 100%; we also agree that in most HDR content 50% of the image at 100% level is probably not going to happen very often. ANSI is also one of the hardest patterns to measure properly because unless you have a flat black room to measure (preferably black velvet lined), the extreme amount of light produced by the large areas of 100% white reflect off the walls, ceiling, and floor to throw off the actual measurements in the room. There is also, “Dynamic Contrast,” “Peak Contrast,” and “Native Contrast,” which manufacturers usually just call “contrast”. What we do in comparing home theater projectors is average both “Dynamic Contrast” and “Native Contrast”.
This is the only fair way we have found to compare the new higher-end projectors which can do “Infinite” contrast, or “absolute” contrast, as they are able to go all the way to 0 at pure black, or 0 IRE. Even though they can go all the way to black, it doesn’t tell you how well its image will look unless you take into account its native contrast and what it can do with both light and dark areas on the screen at the same time as we find in HDR images. The human eye will also tend to go to the higher brightness image, which is not always the better contrast.
Here the brighter BenQ image on the right will attract the eye but the actual measured contrast takes into account the full range of light to dark and this still image does not show the real difference in the measured and viewed darker blacks on the actual screen. Note: Color was removed from this image to better show only the contrast differences.
The BenQ HT2550 has the higher light output, but because it also has the less-dark black levels it measured slightly less contrast than the Optoma in both dynamic and native contrast tests. We anticipated that the native contrast and dynamic contrast might be slightly higher on the BenQ, due to its higher light output, but it was not due to the better blacks on the Optoma.
Black Levels and Contrast Measurements
| Pure Black | Near Black | Semi Black | Contrast | Lumens (Cinema Hi Lamp Mode) |
|
| Optoma UHD50 | .05 fc | .12 fc | .22 | 2,200 | 1,381 |
| BenQ HT2550 | .09 fc | .17 fc | .36 | 1,688 | 1,909 |
Note: Above measurements are for this comparison only – for this room and with these sample projectors. Other rooms and other projector samples can, and will, vary from these tests.


I’m so impressed with this side by side comparison, this was so well done! Thanks for putting in the hard work, and utilizing tools we don’t have to put this together. I don’t see any comments on this post so I had to made an account just to thank you for this well done article.
Thank you! We appreciate the kind words! Keep us in mind for your next projector purchase! We’d love to help you even more!
Hi, Would you mind sharing your calibration settings for the above review?
Since every projector and it’s calibration settings are unique (even if they’re the same model), we do not post the settings. The HT9060 does come with “factory Calibration” which is suitable for most applications.
I just sign up to thank you so much…
It really impressive comparation I have read many but u r the best
Thanks again